S-Trader Desktop
S-Trader Desktop
  • Charting
    • Introduction


      • Charting Engine Overview
      • Chart Types
      • Chart Time Frames
      • Symbol Management
    • Core Features


      • Annotations & Tools
      • Built-in Studies
      • Custom Studies
      • SVA Studies
      • Expert Advisers
    • Advanced Features


      • Loop System Steps
      • Chart Trading Panel
      • Consensus Reports
    • Working With Charts


      • Chart Settings
      • Chart Templates
      • Chart Management
  • Quant Script
    • Overview


      • At A Glance
      • Primitives
      • Built-in Studies
      • SVA Studies
    • Core Features


      • Code Editor
      • Code Wizard
    • Basic Applications


      • Custom Studies
      • Expert Advisers
      • Consensus Reports
    • Advanced Applications


      • Scripted Alerts
      • Loop Systems
      • Portfolio Systems
  • Full Modules
    • Trading Modules


      • At A Glance
      • Quote List Module
      • Scripted Alerts
      • Loop Systems
    • Relative Strength Modules


      • At A Glance
      • Portfolio Systems
      • Relative Rotation Graphs
    • Auxiliary Models


      • Trade Panel
      • Event Scheduler
      • Premium News
      • Status Panel
    • Platform Tools


      • Organizer
      • Back-Up and Restore
  • Data Feeds
    • Introduction


      • At A Glance
      • Data Feed Comparison
    • Local Data


      • Supported Formats
      • Data Templates
      • Local Data Utility
    • The Instrument Panel


      • Live Data
      • Local Data
      • Downloaded Data
      • Symbol Search
      • Composite Symbols
    • Symbol Utilities


      • XL to XML Symbol Utility
      • IB Symbol Search
  • Order Routing
    • Introduction


      • At A Glance
      • Broker Manager
    • Order Types


      • Available Order Types
      • Auto-Trading
    • Cross-feed Order Routing


      • At A Glance
      • Symbol Pegging
    • Managing Orders


      • From Charts
      • From Order Dialog
      • From Blotter
  • Portfolio Management
    • Desktop Platform


      • Master Account Link
      • Group Order Routing
    • Web Platform


      • Full CRM / PMS
  • Get Started
    • New to S-Trader ?


      • Software Installation Guide
      • Video Tutorials
    • Licensing


      • Licensing Options
      • Volume Licensing
    • For Individuals


      • S-Trader Community
    • For Institutions


      • Enterprise Solution
      • Fintech Development
×
Search Results

Perceived & intrinsic values ultimately correlate

Divergences between the direction and the level of perceived and intrinsic values tend to be short lived. At some point, market values end up inevitably correlating with fundamental values.

We are passionate students of the behavioural approach to finance but are keenly aware of the importance of fundamentals and fundamental analysis. For one thing some basic level of fundamental analysis is absolutely necessary in order to understand big-picture things about markets such as the overall business and investment climate, prevailing valuation measures or even who the active players are in certain industries and what their views and expectations are regarding future threats and opportunities. Moreover, most bond and stock valuation models are based on the concepts of cash-flow timing and time value of money which are not only essential in the world of finance but indeed very sound. Such models offer us the possibility to determine what assets should be trading at based on their intrinsic value and to subsequently compare the calculated “fair value” with the actual market value. The exercise is useful because historically, fair and intrinsic values ultimate intersect and have some relevance in regards to one-another.

At the micro level, the balance between “fair value” and actual market prices is important in more ways than one. Assuming the pricing model used for determining the intrinsic value of assets is based on reasonable assumptions, big gaps between intrinsic value and actual market value, whether in favour or against intrinsic values, can be viewed in and by themselves as a measure of excessively bearish or excessively bullish market sentiment. In addition, pre-scanning investment opportunities based on their fundamental worth in the first place puts the analyst in a position to avoid risks he/she should not take or even traps he/she should obviously not fall in.

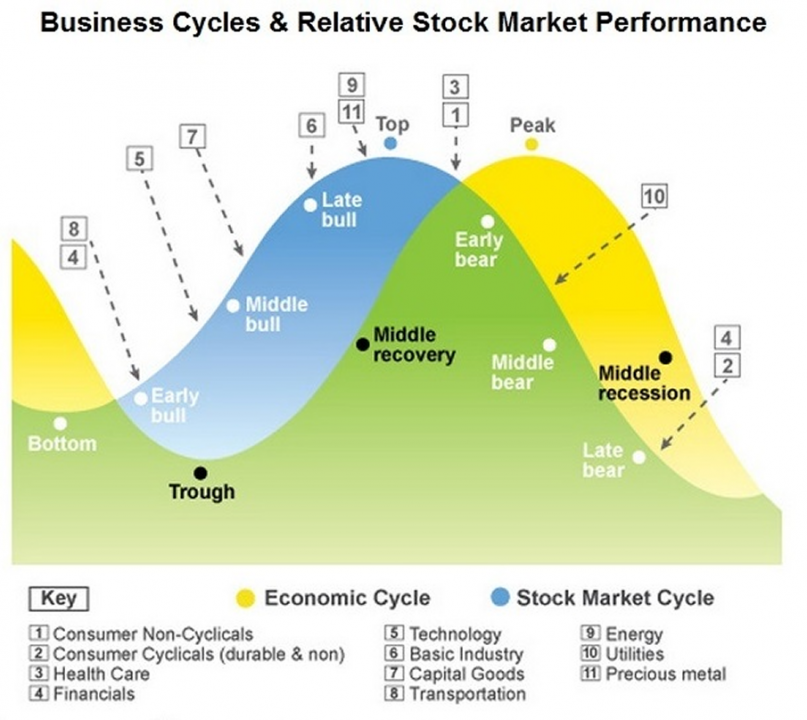
Very importantly, at the macro level, every single major economic variable such as GDP, employment, inflation, trade balances and others has a proven history of lagging behind markets. This means that peaks and troughs in markets precede – rather than follow or react to, as it is commonly believed – peaks and troughs in the economic cycle. The major implication of this reality is that the discrepancy will be the biggest at major turning points whereas the economic climate will look the worst as the market bottoms or look the best as the market tops. Accounting for this relationship between the market and the economic cycle is of exceptional importance. 

Azoom | Responsive Wordpress Theme

All content on this website is copyright protected material of S-Trader.com and its partners

Quick Links


  • Privacy Policy
  • Legal – Please read carefully
  • Snapshot Gallery

Partners & Affiliates


  • Affiliates Sign-Up
  • Affiliate login
  • Fintech Development
© Copyright www.s-trader.com, 2004-2018