
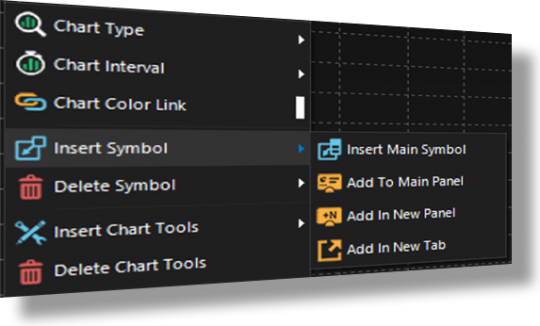
Single & composite symbols.
Plot single or composite symbols in the same panel, on the same chart or on different tabs.
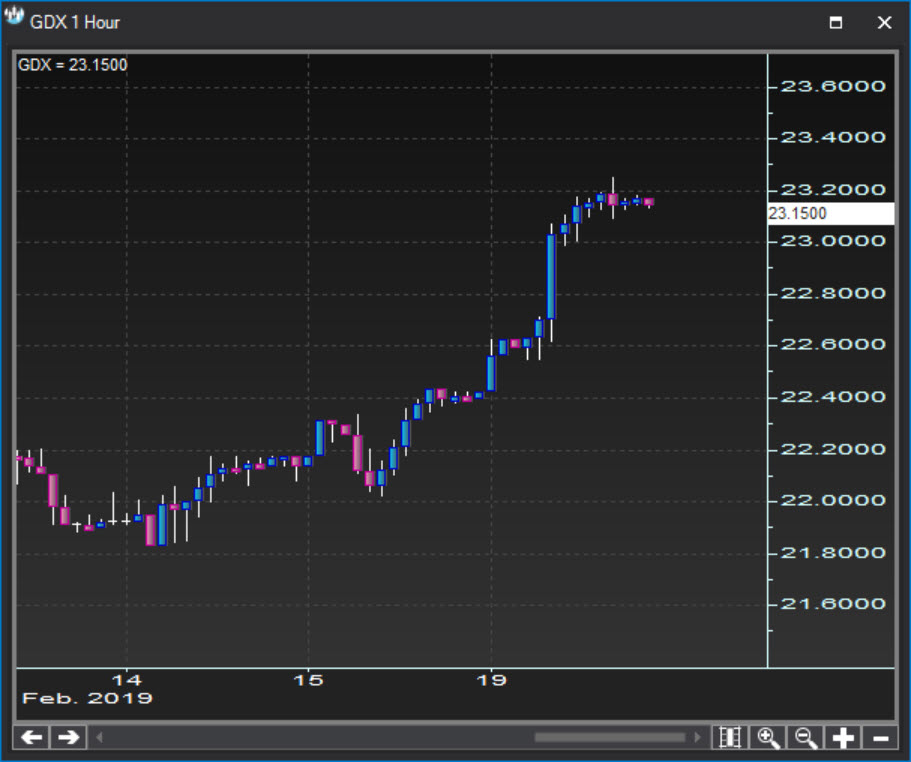
Main Panel
By default, every chart will open with data for the instrument you requested:
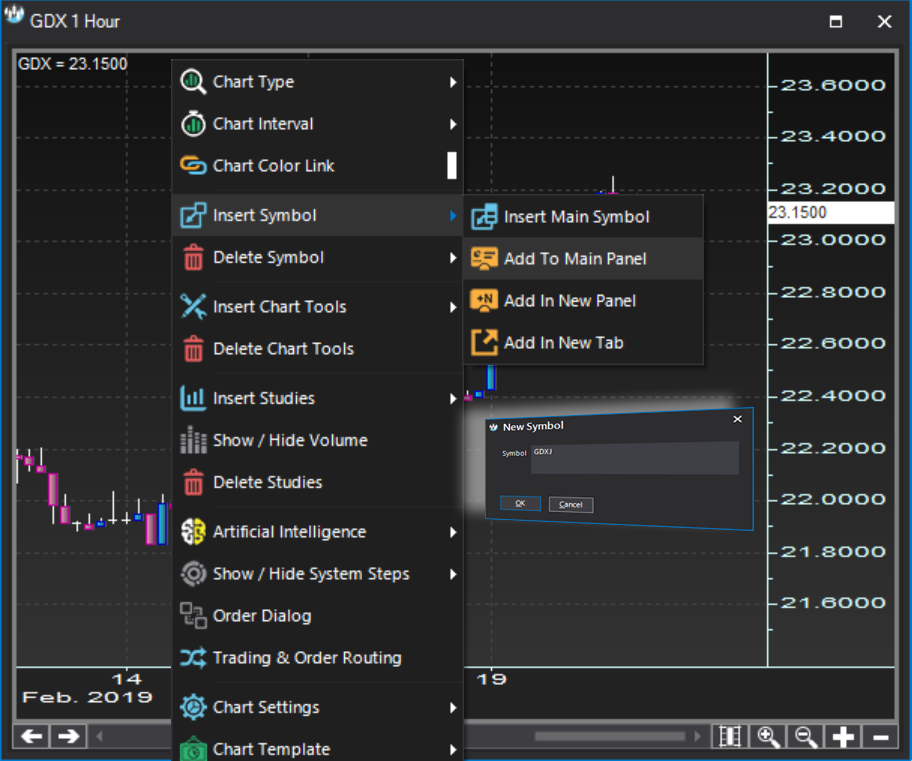
Same Panel
Symbols can be added to the main panel, in which case the plots will become a performance chart:
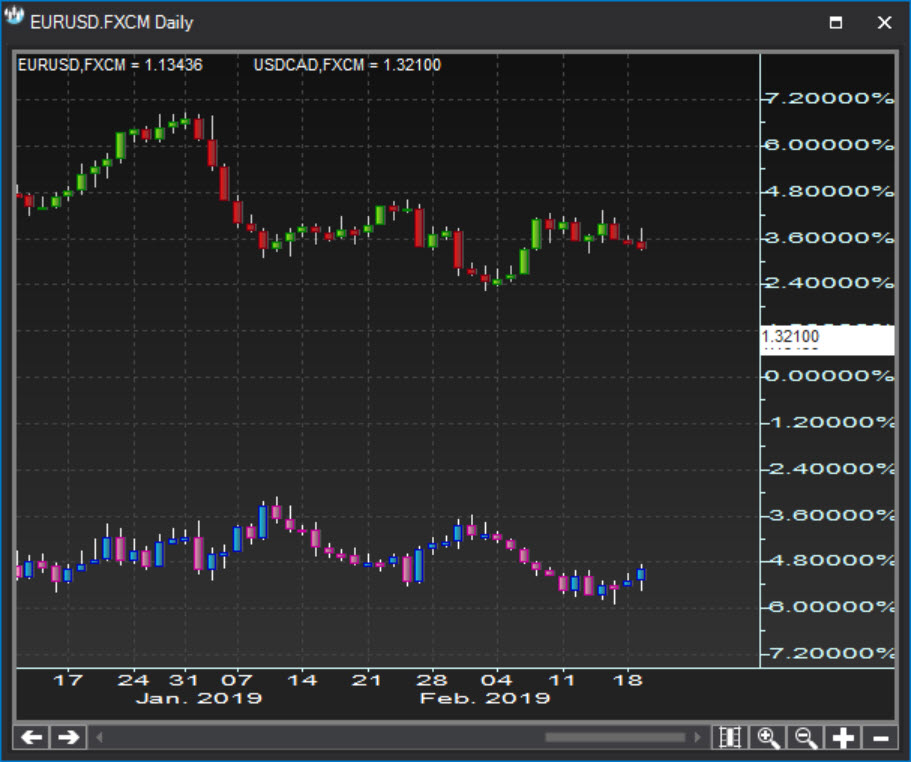
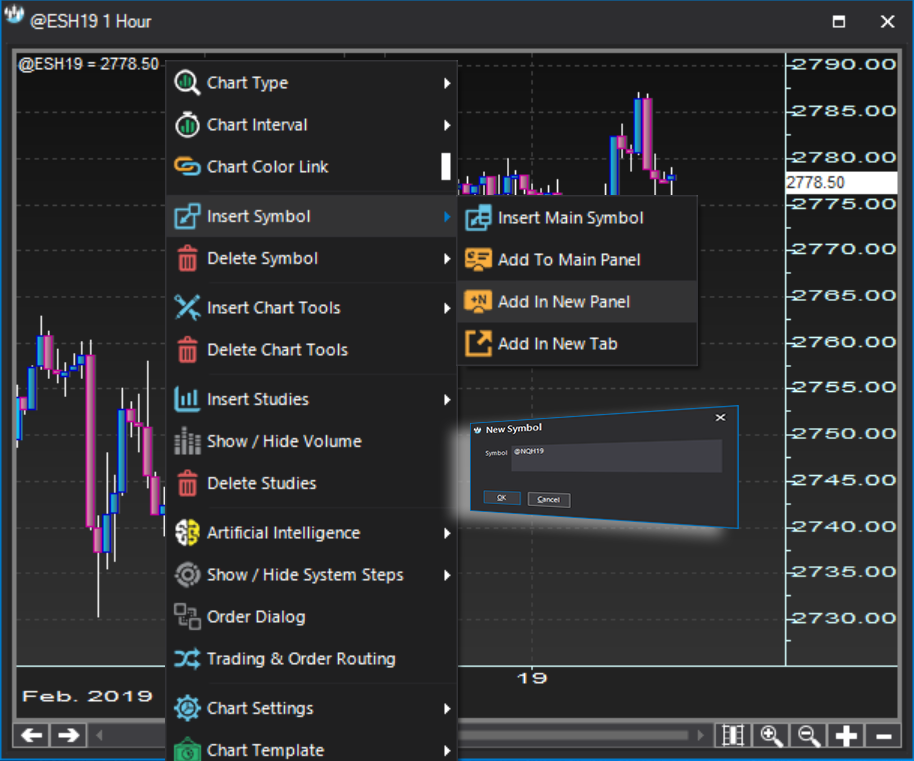
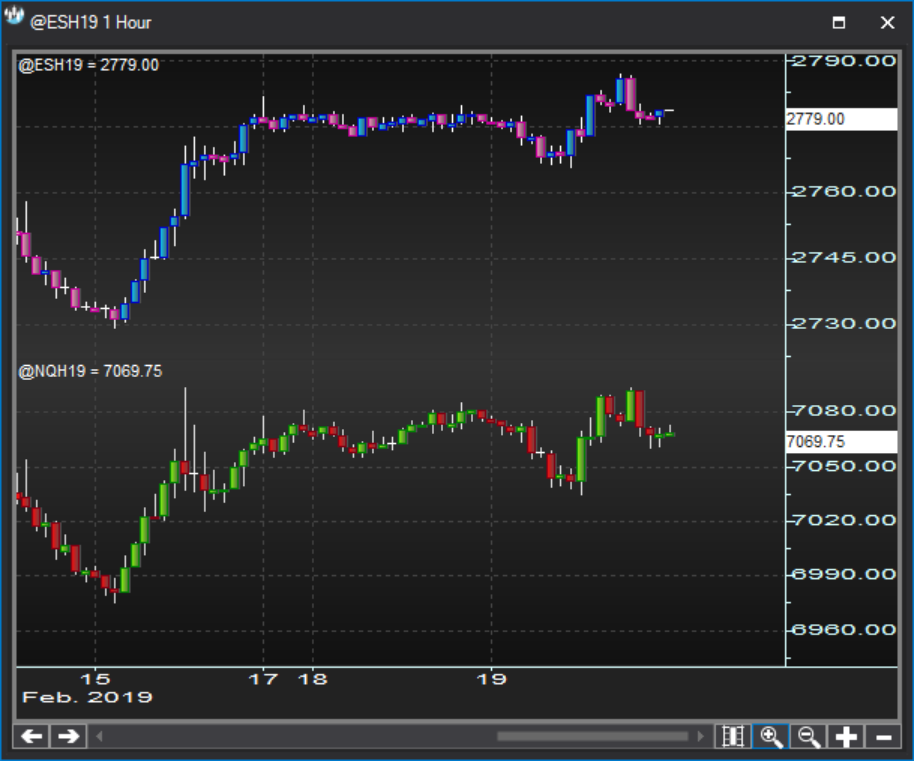
Separate Panel
Symbols can be added to a new panel, in which case the plots will be independent:
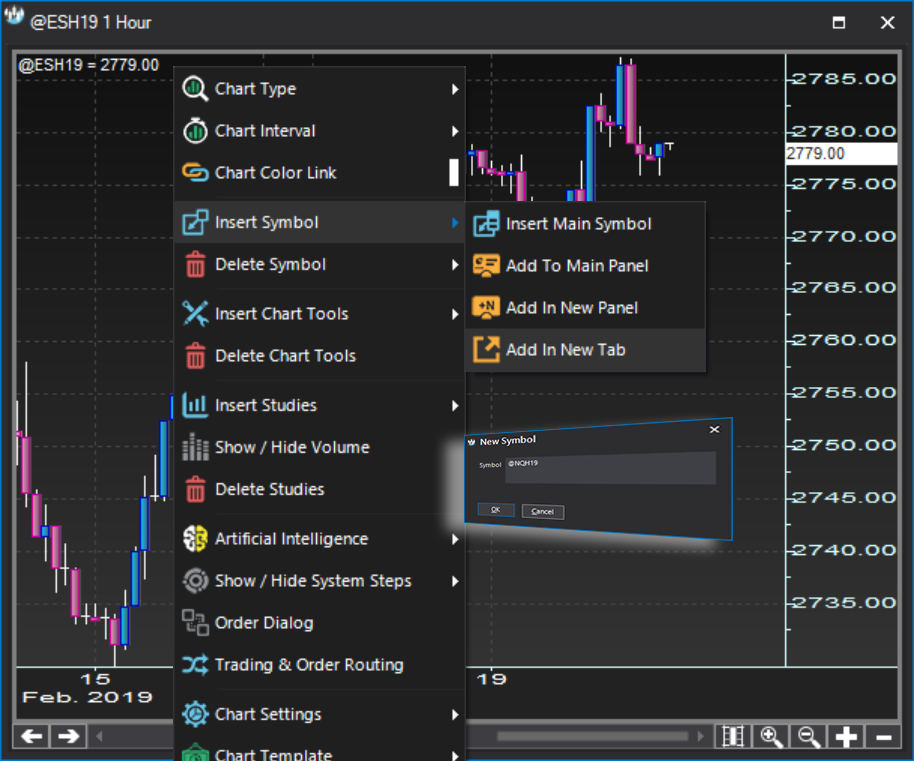
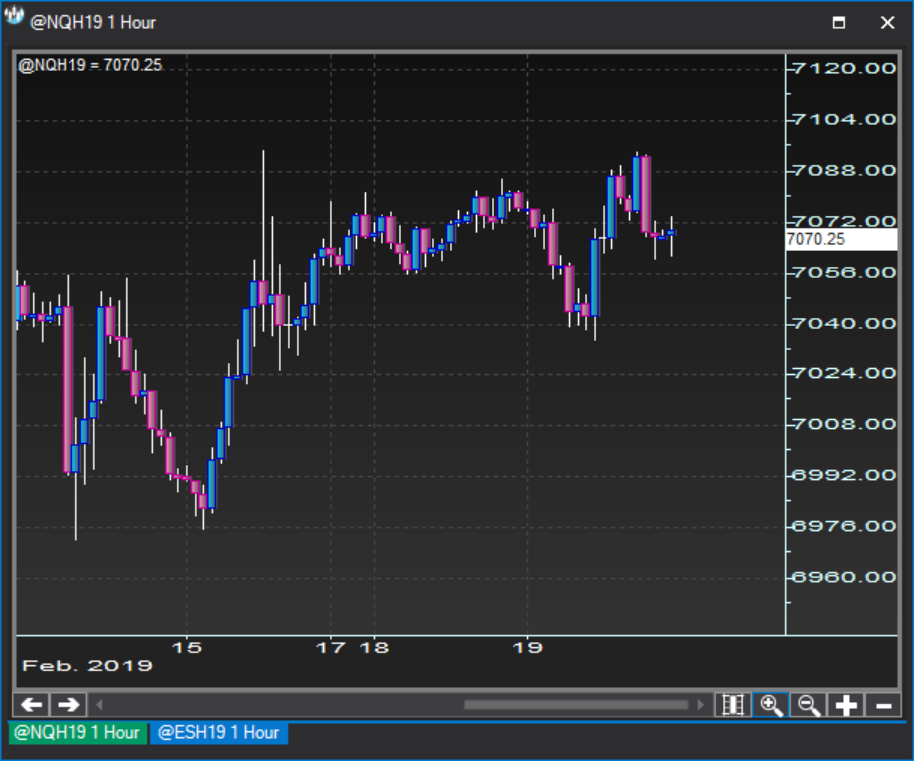
Separate Tab
Symbols can also be added to a new tab, in which case you will end up with two independent charts hosted in the same chart frame for optimal performance and use of pixel space:
Live Data Composite Symbols
Composite symbols of any level of complexity can be plotted as a "close-only" - or line - chart in any desired time frame. The typical math operator rules apply and symbols must be inserted inside square brackets "[ Instrument Symbol ]".
For instance a composite symbol built as [QGC#]/[QSI#] would end up being plotted as a line chart of the Gold futures / Silver futures continuous contracts.
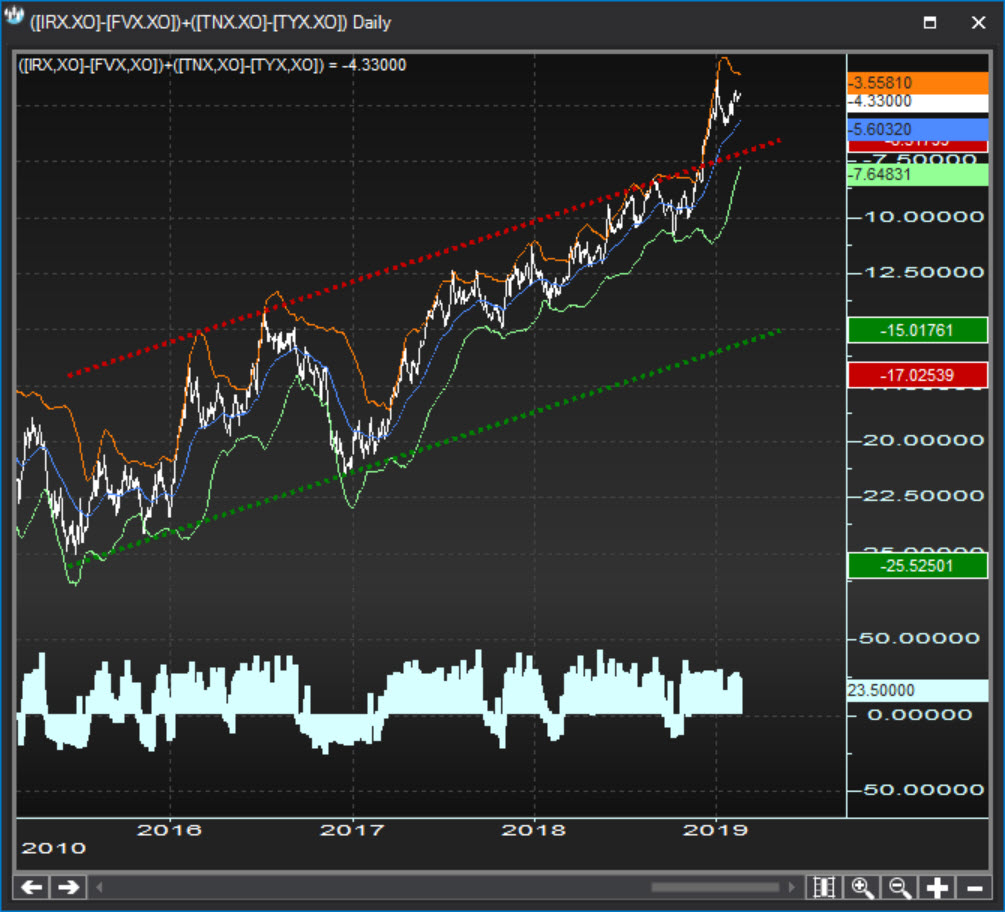
As another example, a composite symbol built as ([IRX.XO]-[FVX.XO])+([TNX.XO]-[TYX.XO]) would end up being plotted as a line chart of the sum between the 13 week minus the 5 year yield spread and the 10 year minus the 30 year yield spread:
Local Data Composite Symbols
Similarly, composite symbols of any level of complexity can be built out of local data files. To build Local Data Composites you must:
- Peg the local data files using the Local Data dialog;
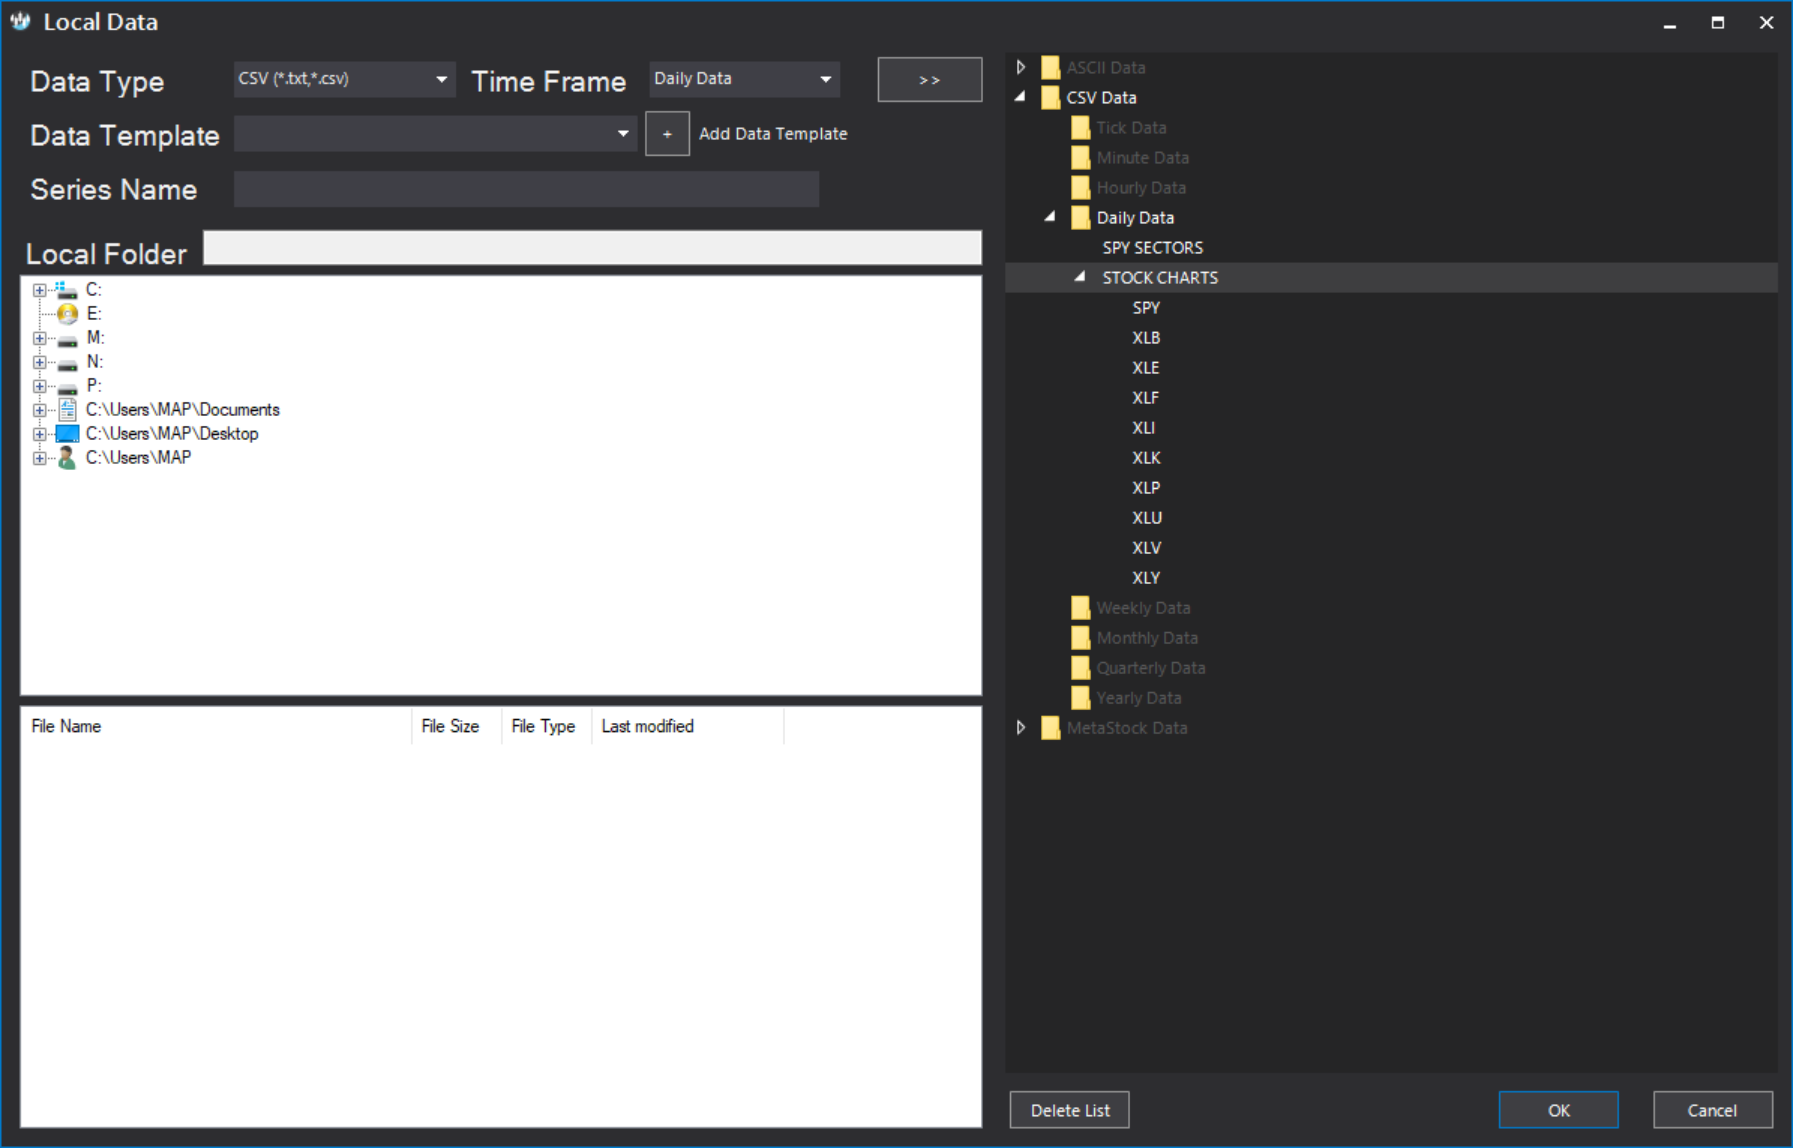
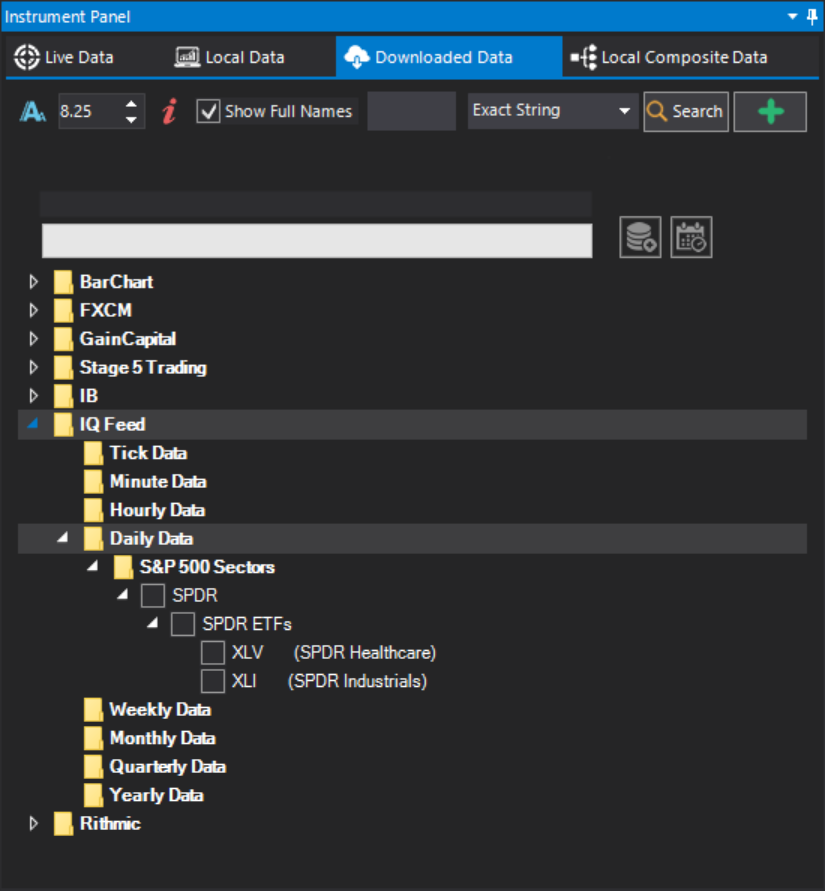
- Alternatively, download data from a streaming provider;
- Use the Local Composite Data dialog to build local data composite symbols;
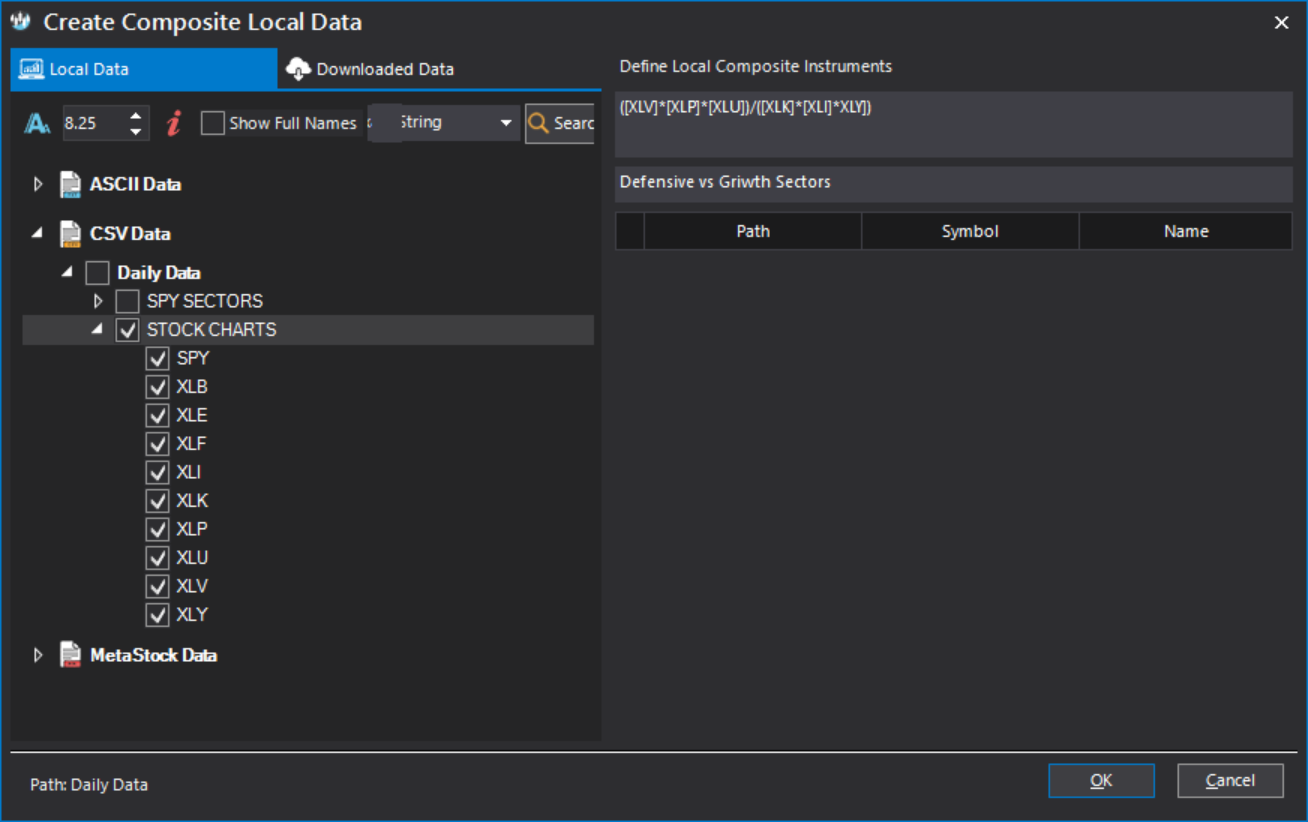
The typical math operator rules apply and symbols must be inserted inside square brackets "[ Instrument Symbol ]". Local data composites will also be plotted as a "close-only" - or line - chart in the time frame they are created.
© Copyright www.s-trader.com, 2004-2018